Cut the Bell
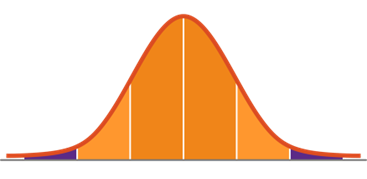
One little toy I’ve always found fascinating is the Galton Board. You may not have heard of it, but if you ever mindlessly scroll YouTube or Instagram like me sometimes – I am sure you’ve come across this small glass box with small metal balls poured on from the top. These randomly fall and hit spaces within the Galton board and yet they invariably fall to arrange themselves into a ‘bell’ shaped pattern. This mound of balls falls into what we commonly known as Gaussian or “Normal” distribution. Most random things arrange themselves (at least somewhat) into this formation. This is following the Central Limit Theorem in Math. In fact, most human experiences follow this pattern. Plot human height on a bar chart, what do you get? A bell. People’s reaction times? Bell. Plot shoe sizes, what do you get? A bell. Plot the circumference of bells on a plot, and what do you get? I have never tried plotting it – but I assume you get a bell curve!
For many years, it has also been how we visualize employee performance. In the context of talent management this feels, for the lack of a better word, fair. It makes intuitive sense that most people are average or near-average performers with both the best and the worst performers tapering off at the two ends of a bell-shaped curve. It represents people are being clustered around the mean. This idea is so ubiquitous that we see organizations with a performance calibration process where a “curve-fitting” exercise is undertaken. This is essentially to force-distribute people by rating on the bell curve. Now, a lot of the customers I’ve worked with swear by this practice and I’ve had many a healthy debate on this. Sure, this makes perfect sense in some cases too. If you have a performance linked compensation and don’t want to spread your resources too thin, you must be mindful of how people are rated. Also, I’ve seen way too many talent management processes to claim that there’s just one way of doing things. However, by assuming that normal distribution is representational of reality, we may end up under-rewarding our best people while being extremely harsh to those who need only a little help to do better.
The fact that GE, which popularized this concept in the first place, got rid of the bell curve fitting says something about the truthiness of the bell curve. Human performance isn’t a random and finite occurrence. It is deliberate, and, it doesn’t have finite variance. It is possible to have vast differences in performance. When approached with a growth mindset – this creates an upwards climb for all involved. If we curve fit, we may be essentially denying the truth its right to assert itself in our data. We’ve forced a narrow view unto the complex intricacies of reality. If we simply collect the data and don’t fit it (and ensure the data is actually representative), we are more likely to see what’s called a Power Law or Pareto Curve.
As opposed to the bell curve, this curve typically shows that there are a small number of very high performers, with a long tail of variably average performers and a low number of under-performers. It is named after the Pareto Principle which, and I am generalizing, states that 80% of the outcomes come from 20% of the inputs. Basically, a smaller number of people give organizations outsized returns. It implies that there are some super-talents in a team, and most people are below the mean. This doesn’t mean they are low performers though. But this truth only surfaces when we stop trying to force-fit people in the bell curve, and let the data speak without bias or forced comparison between nuanced and complex work outputs. Depending on your industry and culture (and all talent management is a culture setting or culture preserving exercise), this may make a lot more sense than using a bell representation.
This helps deliver a mindset shift in how we see our people. Any performance measurement system will only be successful if continuous improvement and feedback are built into it, moving everyone constantly towards a north star. Otherwise, the performance review becomes the dreaded, boring, mundane and perfunctory process we all know and hate. In terms of rewards too, it is important to shift from a forced bell curve mindset to reward people fairly and retain top talent with a disproportionate impact on your organization. That’s what happened at Microsoft. They found that their best people were leaving because of forced curve fitting. They ditched the bell.
While I understand the Bell Curve has served many organizations well for years, or at least it feels that way – I do urge organizations to reconsider their strategy for Talent Management to make it a true lever in their success. Talent can give you outsized returns if done right.
Acceptance of the Pareto Curve is just one of the many, many mind-set changes required to make Talent Management processes truly useful in building high performance teams and delivering hard-hitting results, but those are for future blog posts! For this new year, all I ask is that you relook at some of the oldest truths about talent management and consider some changes that would help your organization soar to new heights in 2024 and beyond!
We at Orbrick believe that value follows the pareto-principle too. Small investments can yield outsized returns. We love working with customers to unlock those paretos in their own organizations. Speak with me directly to discuss how we can help make Talent Management (or HCM in general) deliver more for you.
Recent Posts

Categories
 Design Office
Latest News

Website Launch And 3 Lessons From Chandrayan-3
January 16, 2024


Real Time Visibility In Supply Chain
January 16, 2024